
Bitcoin clung to the $51,700 support level at the start of the week, but signs of weak buying support appeared as it retreated towards $51,000 amid intense selling pressure.
Short-term analysis points to intermediate support at $50,700, with a possible corrective trend triggered by a daily close below this level, targeting the next support at $49,500.
While the broader outlook suggests that Bitcoin is touching the upper edge of an ascending channel on the weekly chart, a potential correction is on the horizon.
In 2024, invest like the big institutions from the comfort of your home with AI-powered ProPicks stock picker. Learn more here
In the first half of the week, Bitcoin held the support level of $51,700, a level we have been monitoring since February 15.
However, as of yesterday, there were signs that buying momentum at this price had weakened.
The digital currency is currently going through the second phase of consolidation after the initial rally in February. The price action was similar to when it was in the $42,500-$43,700 range in the first week of February, with a pause in the uptrend on February 15.
In this article, we will evaluate the situation of the cryptocurrency and focus on the key trading levels to monitor.
Important levels
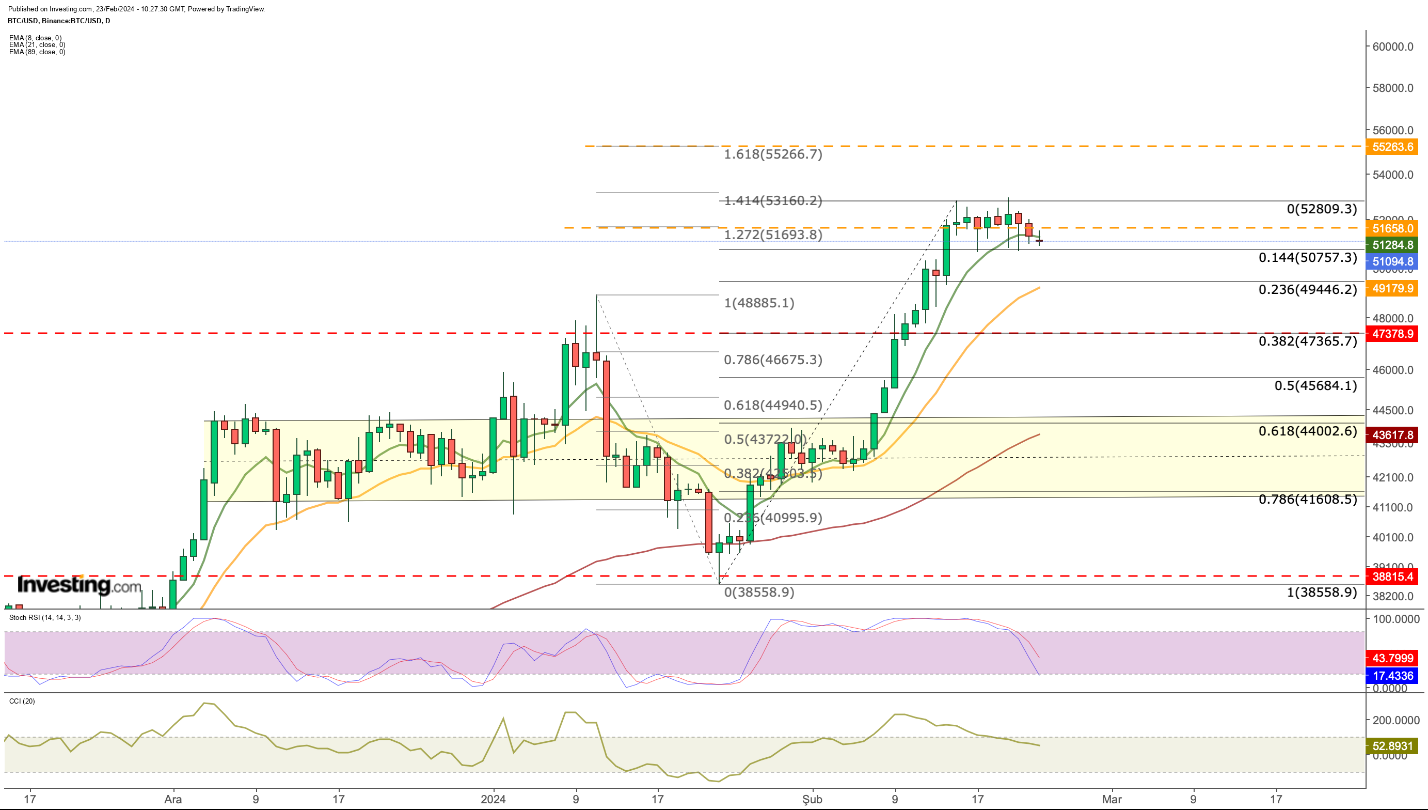
Over the past week, Bitcoin tested the area around $52,000, and encountered resistance at $52,250.
Although buyers successfully defended the $51,700 support level, Bitcoin price fell towards the $51,000 level as selling pressure intensified since yesterday.
Short-term price action analysis reveals intermediate support at $50,700. If there is a daily close below this level, it could trigger a correction, which could take Bitcoin down to around $49,500, which is the next support level.
After losing this support, the next potential pivot point will be around $47,300.
Despite increased selling pressure, a return of buyers around the $50,700 area could trigger a new short rally towards $52,800.
A breakout may continue in the short-term uptrend until $55,000, with initial resistance seen at $53,100.
By examining the daily chart, Bitcoin entered into overbought conditions in February according to the stochastic RSI. The recent bearish trade indicates a short-term correction.
The support point at $50,700, which corresponds to the 0.144 Fib of the recent rise, is gaining importance.
How to trade it
The uptrend, fueled by ETF purchases, has slowed due to falling demand. Blockchain data points to profit-taking by long-term Bitcoin holders after the recent bullish wave.
If the attempt to break the critical support level at $50,700 accelerates, it could trigger a correction.
From a broader perspective, Bitcoin is currently tracking the upper edge of an ascending channel on the weekly chart. The weekly Stochastic Relative Strength Index (RSI) at its current position indicates bullish potential.
However, limited movement within the ascending channel this week suggests that a potential correction may be on the horizon.
Given this perspective, Bitcoin is expected to gain more confidence in its upward trajectory after falling to the $48,000 intermediate level, taking into account the mentioned short-term support levels.
On the other hand, for the cryptocurrency to continue on its path without correction, it must regain the support at $51,700 and close the week at $53,000.
Fulfilling these conditions would convince investors that Bitcoin has broken out of a tight range and could lead to a rapid upward rally towards $55,000, accompanied by an increase in buyer activity.
This scenario is based on the continued importance of Bitcoin spot funds trading in influencing the Bitcoin chart.
Failure to meet these conditions within the next 48 hours may lead to escalation of selling pressure.